Mathematics Graphics Materials by Prof Shirota at Gakushuin Univ.
Selected Mathematics Graphics by Prof Shirota at Gakushuin Univ.
What is the features of my approach :
Visualization and Deductive Reasoning
Please install the CDF player for the graphical tool.
Wolfram CDF Player site
If you use IE by Microsoft as your browser, please add Compatibility Modes "wolfram.com" and "gakushuin.ac.jp"
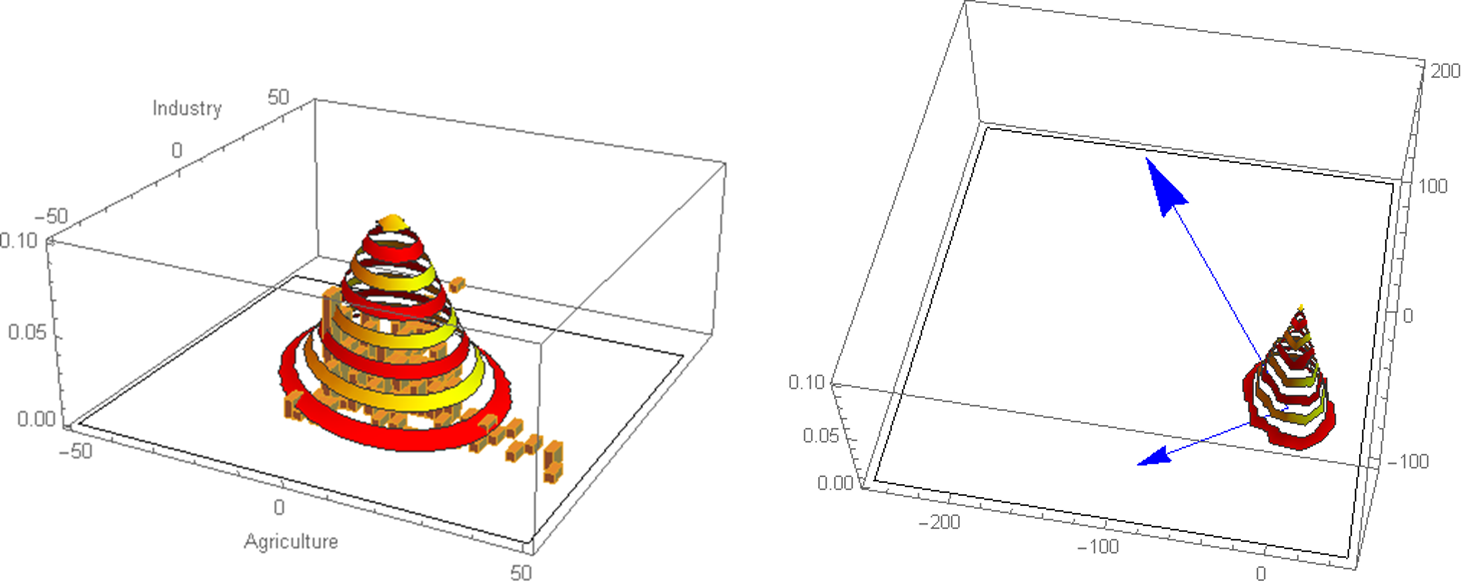
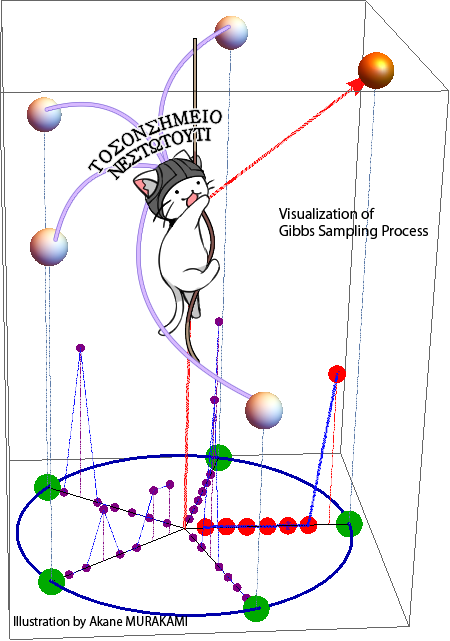
Visualization of Gibbs sampler
Bayesian inferences are widely used in various fields.
This is a visual and interactive teaching materials to study
Gibbs sampler on a simple topic model.
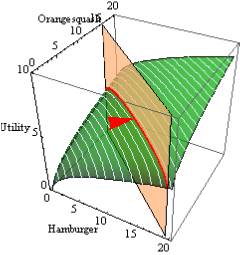
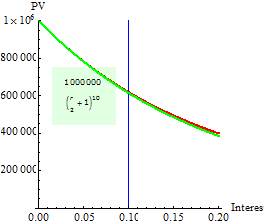
We apply the correlation coefficient to two stock data series to analyze the similarity and visualize that relationship. The stock data are the Japan's two major automobile companies' ones in New York Stock Exchange. The data are in advance standardized. The stock data are cited through Mathematica FinancialData function. As shown in the above figures, when the sum of the squares of distances between the two data is large, the similarity level becomes small. Concerning the covariance, many negative terms are found which leads to that the Company A's is not similar to Company B's.
When the two data are completely the same, the correlation coefficient becomes 1.
The visualization explains the relationship between the covariance which implies the correlation coefficient and the sum of distance squares more eloquently than just the expression itself.
Yukari Shirota, Takako Hashimoto, and Sakurako Suzuki. "Knowledge Visualization of Reasoning for Financial Mathematics with Statistical Theorems." Databases in Networked Information Systems. LNCS 8381,Springer International Publishing, 2014. 132-143.
I am afraid that this e-Book is written in Japanese.
You can execute every Wolfram CDF material in this e-Book which is available with no charge
from the
O'Reilley site.
However the explanations in the CDF materials are written in Japanese.
Then I translated them to English.
I would be grateful if you English readers could enjoy
the English version of the teaching materials which are facilitated with a slider.
Given a word problem of business mathematics, students in my class will have to initially write down the given data and the unknown. We think that one of the most significant objectives of mathematics lectures is to cultivate student's reasoning skills and we use in our classes our original heuristics methods named Inference Engine Method. An inference engine is a kernel of an expert system that holds rule databases like a formula database. Students are supposed to think and behave like an inference engine while conducting the deduction. Given a mathematics word problem, the students will first have to write down the given data and the unknown of the problem. Then they will fing the missing link between them.
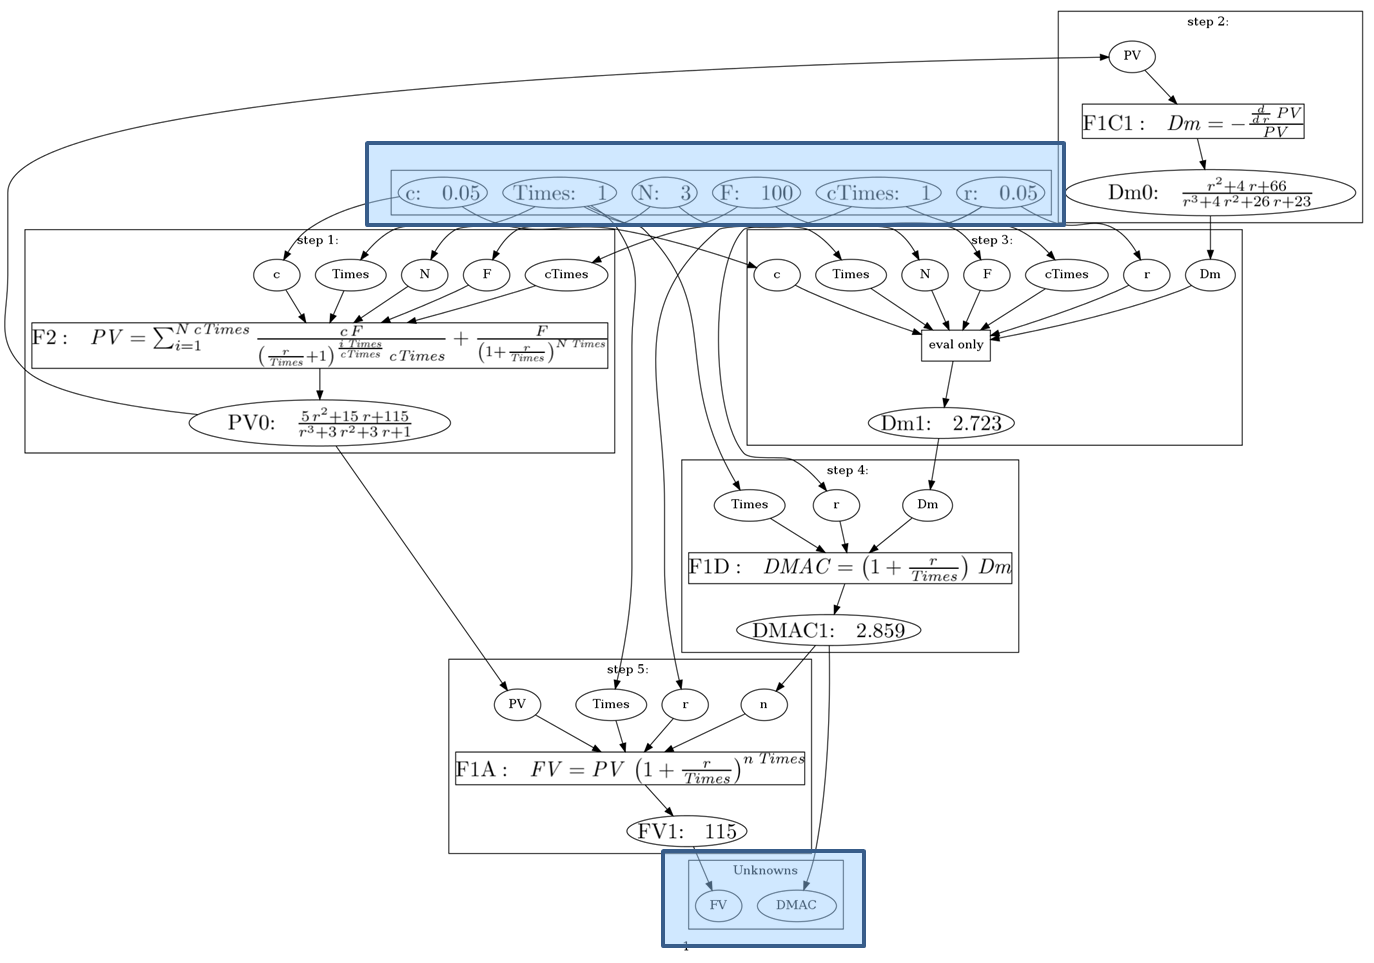
Solution Plan Generator: We have developed a system which automatically draws the solution plan graphs. The system consists of formula databases and a solution plan graph generator.
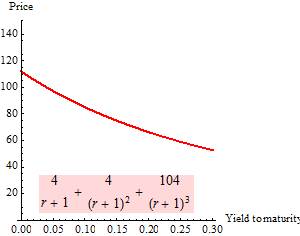
For example, the given data are "Times", "cTimes", "c", "F", "N", and "PV" which are laid out on the top of the graph, and the unknown is "r" that is laid out on the bottom of the graph. MAXIMA and graphviz are used.
Yukari Shirota: Plausible Deductive Reasoning Plan for Business Mathematics Learners-Solution Plan Graph Generator-, Proc. of 2nd Uncertainty Reasoning and Knowledge Engineering(URKE2012),IEEE, Jakarta, August 14-15, 2012, pp.5-8.
E-R Diagram of Bond Math Formulas: That is all you need.
Yukari Shirota et al.: A Concept Model for Solving Bond Mathematics Problems, Edited by Jaak Henno, Yasushi Kiyoki, Takehiro Tokuda, Hannu Jaakkola, Naofumi Yoshida, Frontiers in Artificial Intelligence and Applications, Volume 237, 2012, Information Modelling and Knowledge Bases XXIII, pp.271-286.
Linear Algebra for Economics Course Students, not for Mathematics Dept
I have developed some teaching materials for our students.
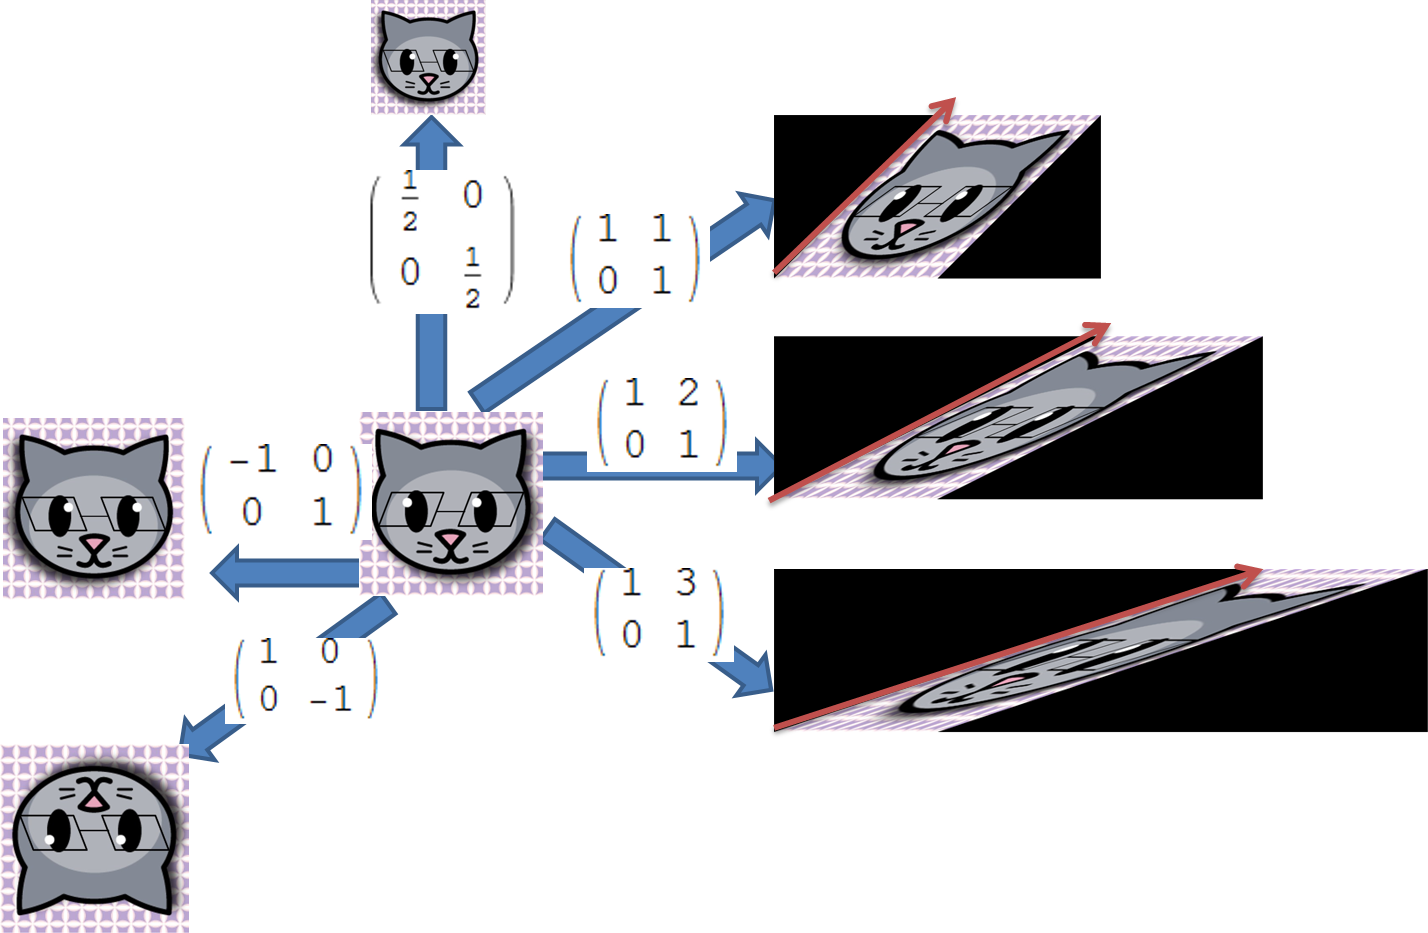
A fable story for understanding eigenvalues titled "Enlargement Factors of
the Magnification Machine are Eigenvalues"
OPEN PDF
Sebuah Cerita Fable untuk Memahami Eigenvalues berjudul ŌĆ£Faktor Pembesaran dari Mesin Pembesar adalah EigenvaluesŌĆØ
OPEN PDF
.gif)